Making Sense of Data
Real-world apps and solutions powered by data
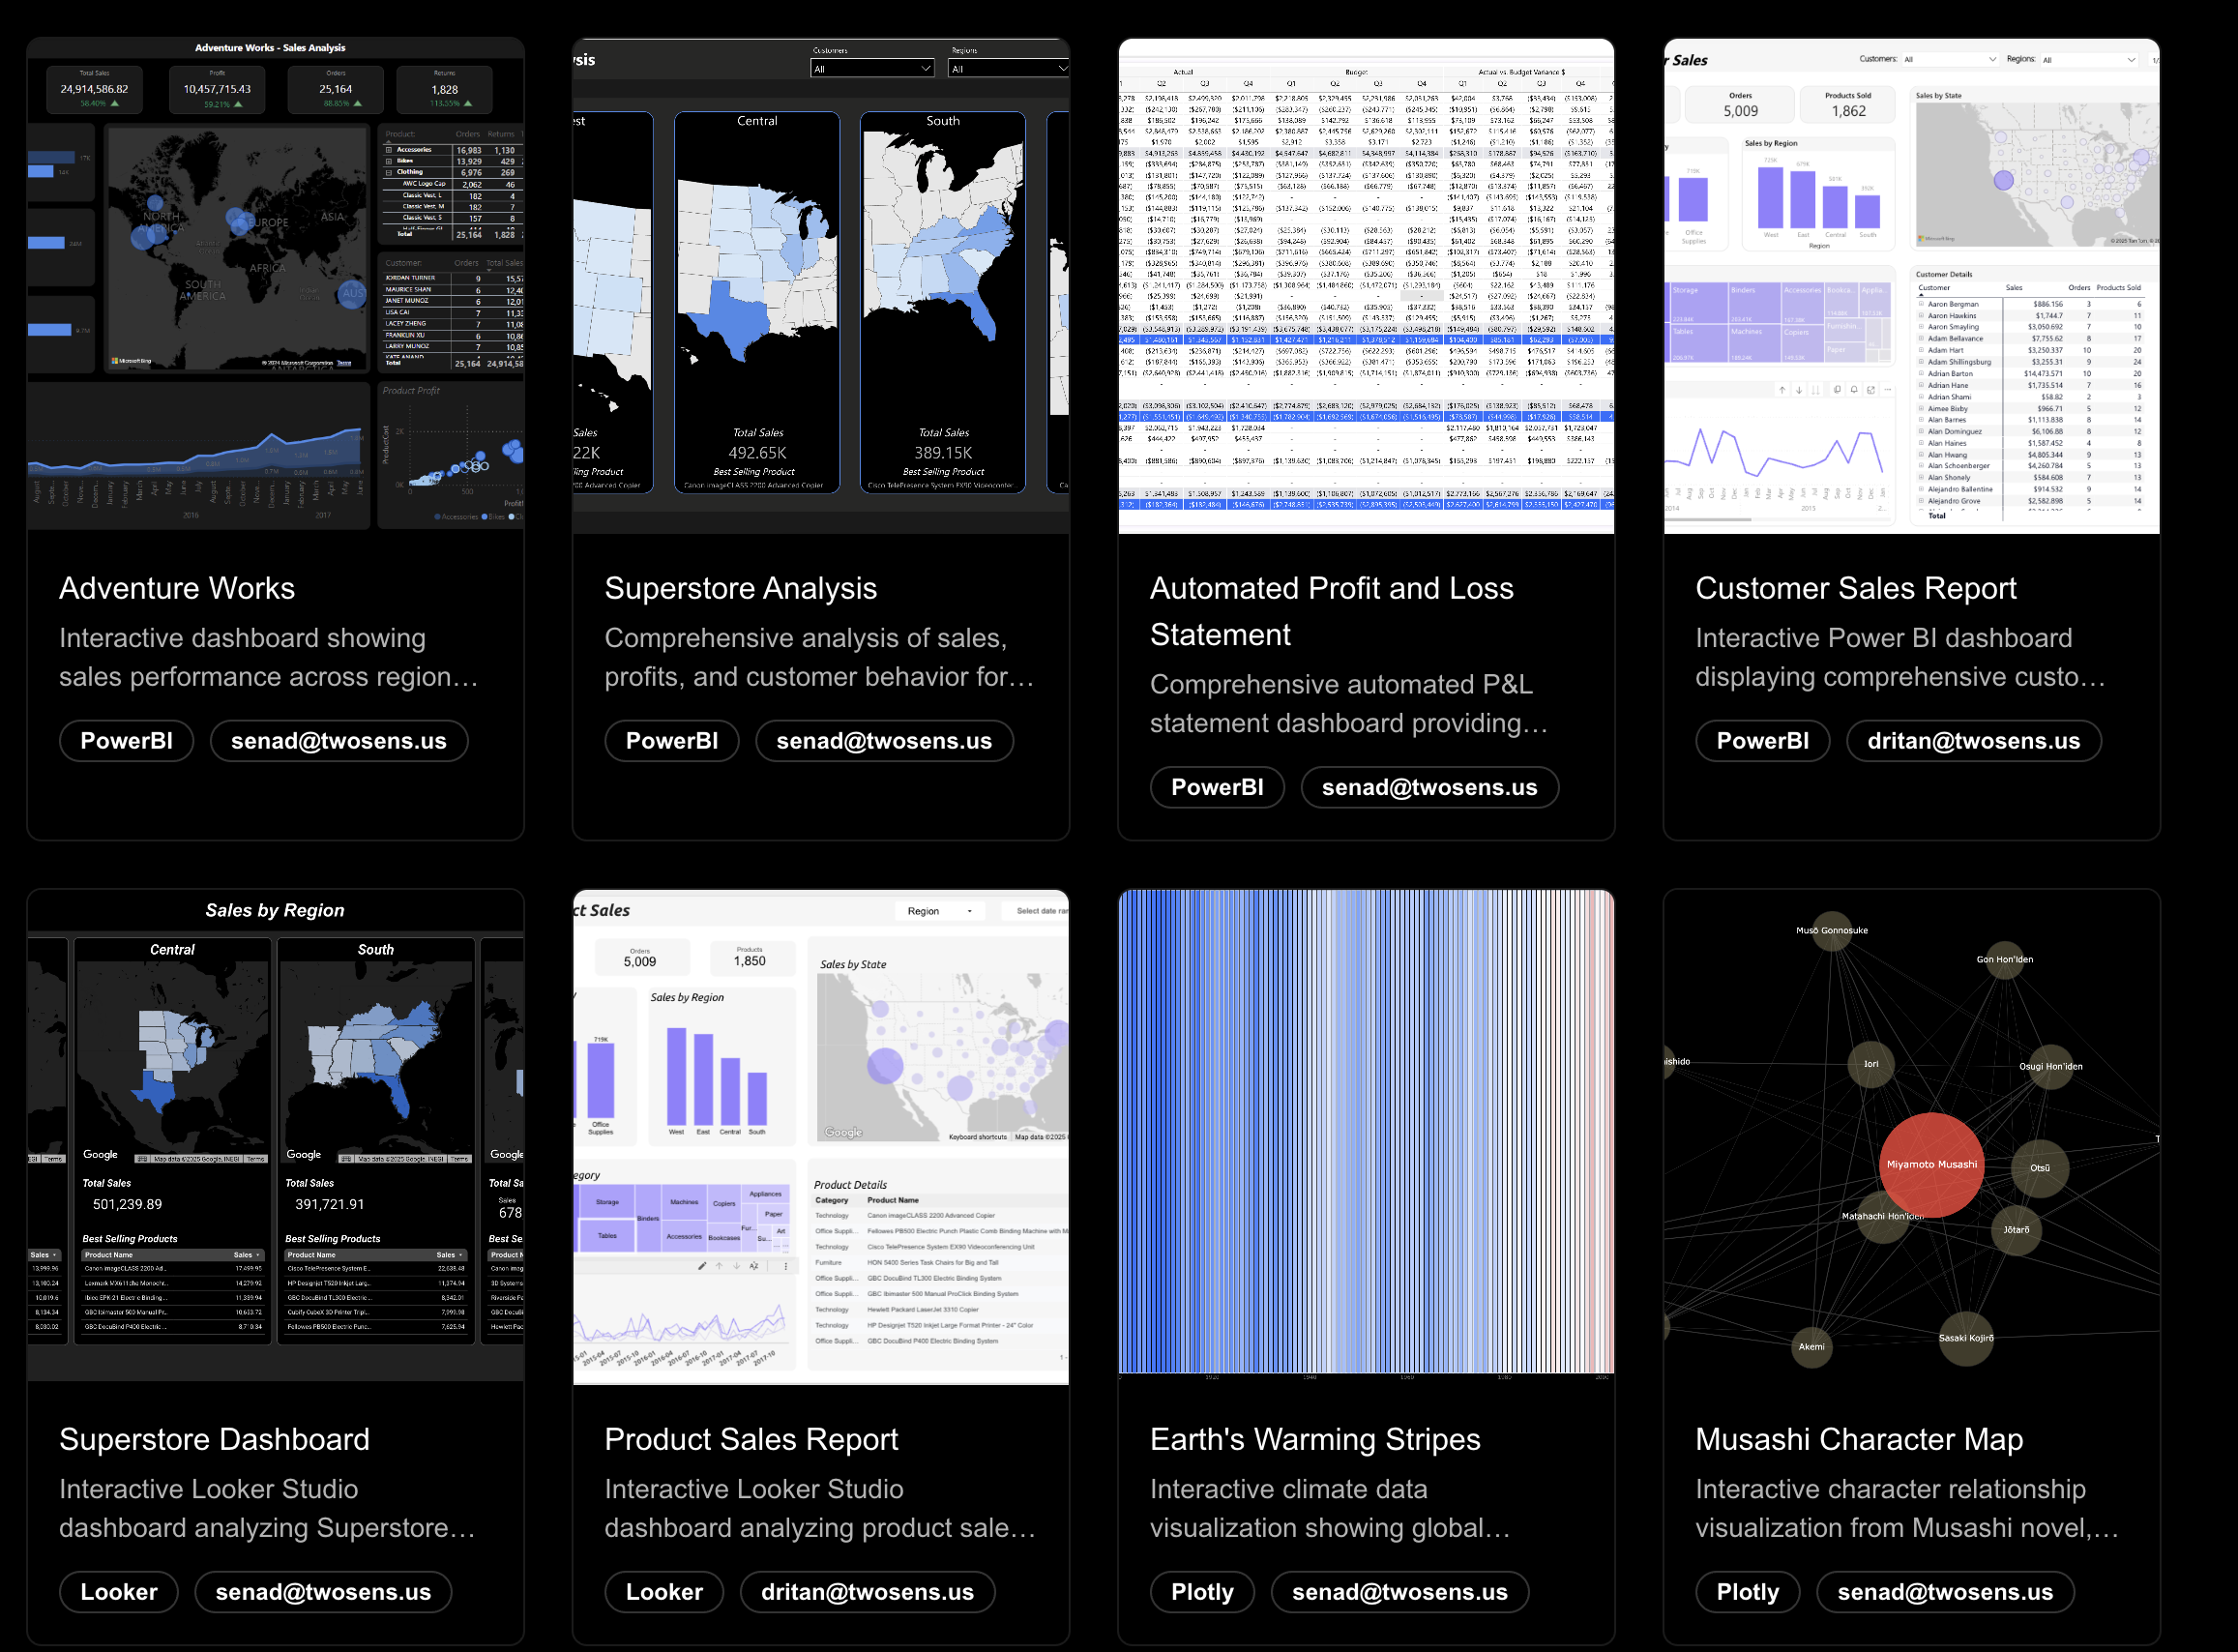
Dashboard Gallery
A collection of custom dashboards and data visualizations built with PowerBI, Looker, and Plotly.
NextRecs
An AI-powered app for entertainment recommendations, built with Gemini AI.
SALES
GROWTH
DashCrafter
The future of data analytics: creating dashboards and reports using natural language. Coming soon...